


Event analytics
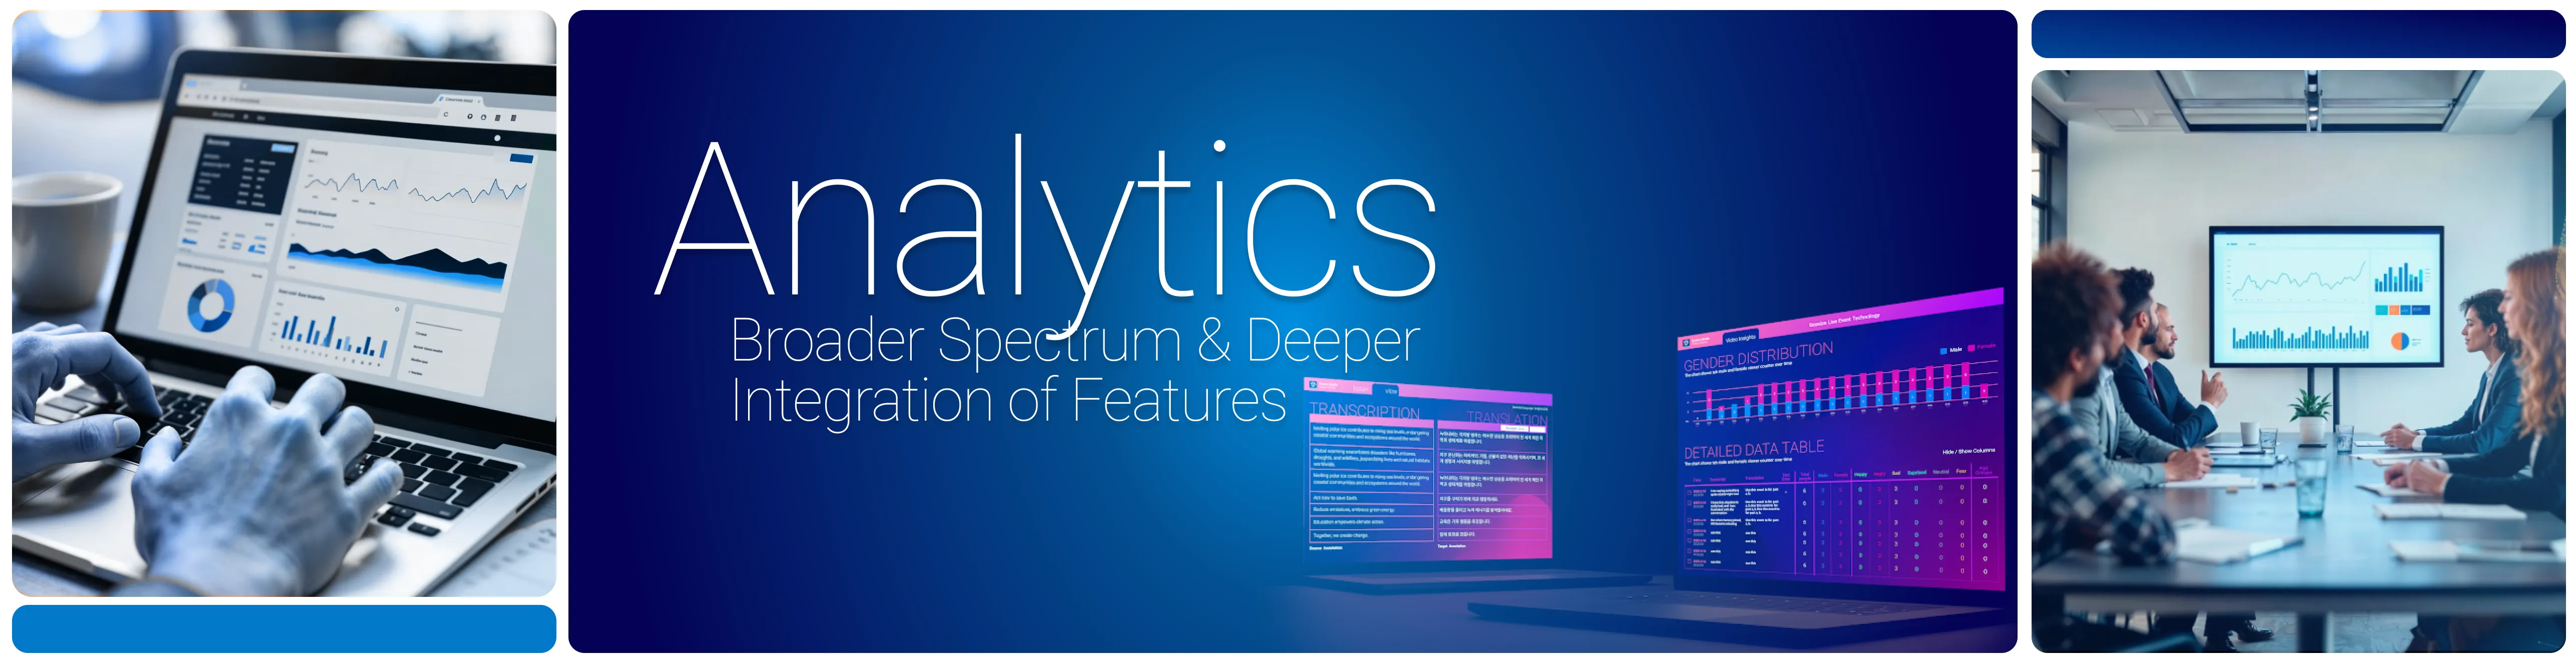
Events.studio’s event analytics platform is an end-to-end intelligence engine that captures real-time attendee engagement, session traffic, NFC dwell times, interactive polling data, and live caption metrics across in-person, hybrid, and virtual events. By consolidating registration records, on-site movement, audience sentiment, and post-event survey data into centralized dashboards, our solution empowers event organizers and enterprise stakeholders to measure true event ROI and optimize future programs with empirical precision.
Event analytics platform — at a glance
| Specification | Details |
|---|---|
| Data capture modes | NFC/RFID badge taps, QR check-in scans, mobile app telemetry, live polling, and caption interactions |
| Reporting latency | Real-time streaming dashboards (sub-second refresh) & post-event automated executive reports |
| Key metrics tracked | Attendance volume, session dwell time, booth traffic, audience reactions, and drop-off points |
| Caption & language analytics | Language distribution %, transcription accuracy rates, bookmarked moments, and live reaction heatmaps |
| Attendee tracking privacy | GDPR and ISO 27001 compliant, aggregated heatmaps, and role-based data encryption |
| Benchmarking & exports | Year-over-year event comparison, industry baseline benchmarking, CSV, Excel, and automated PDF export |
| Core system integrations | Conference registration system and conference mobile application |
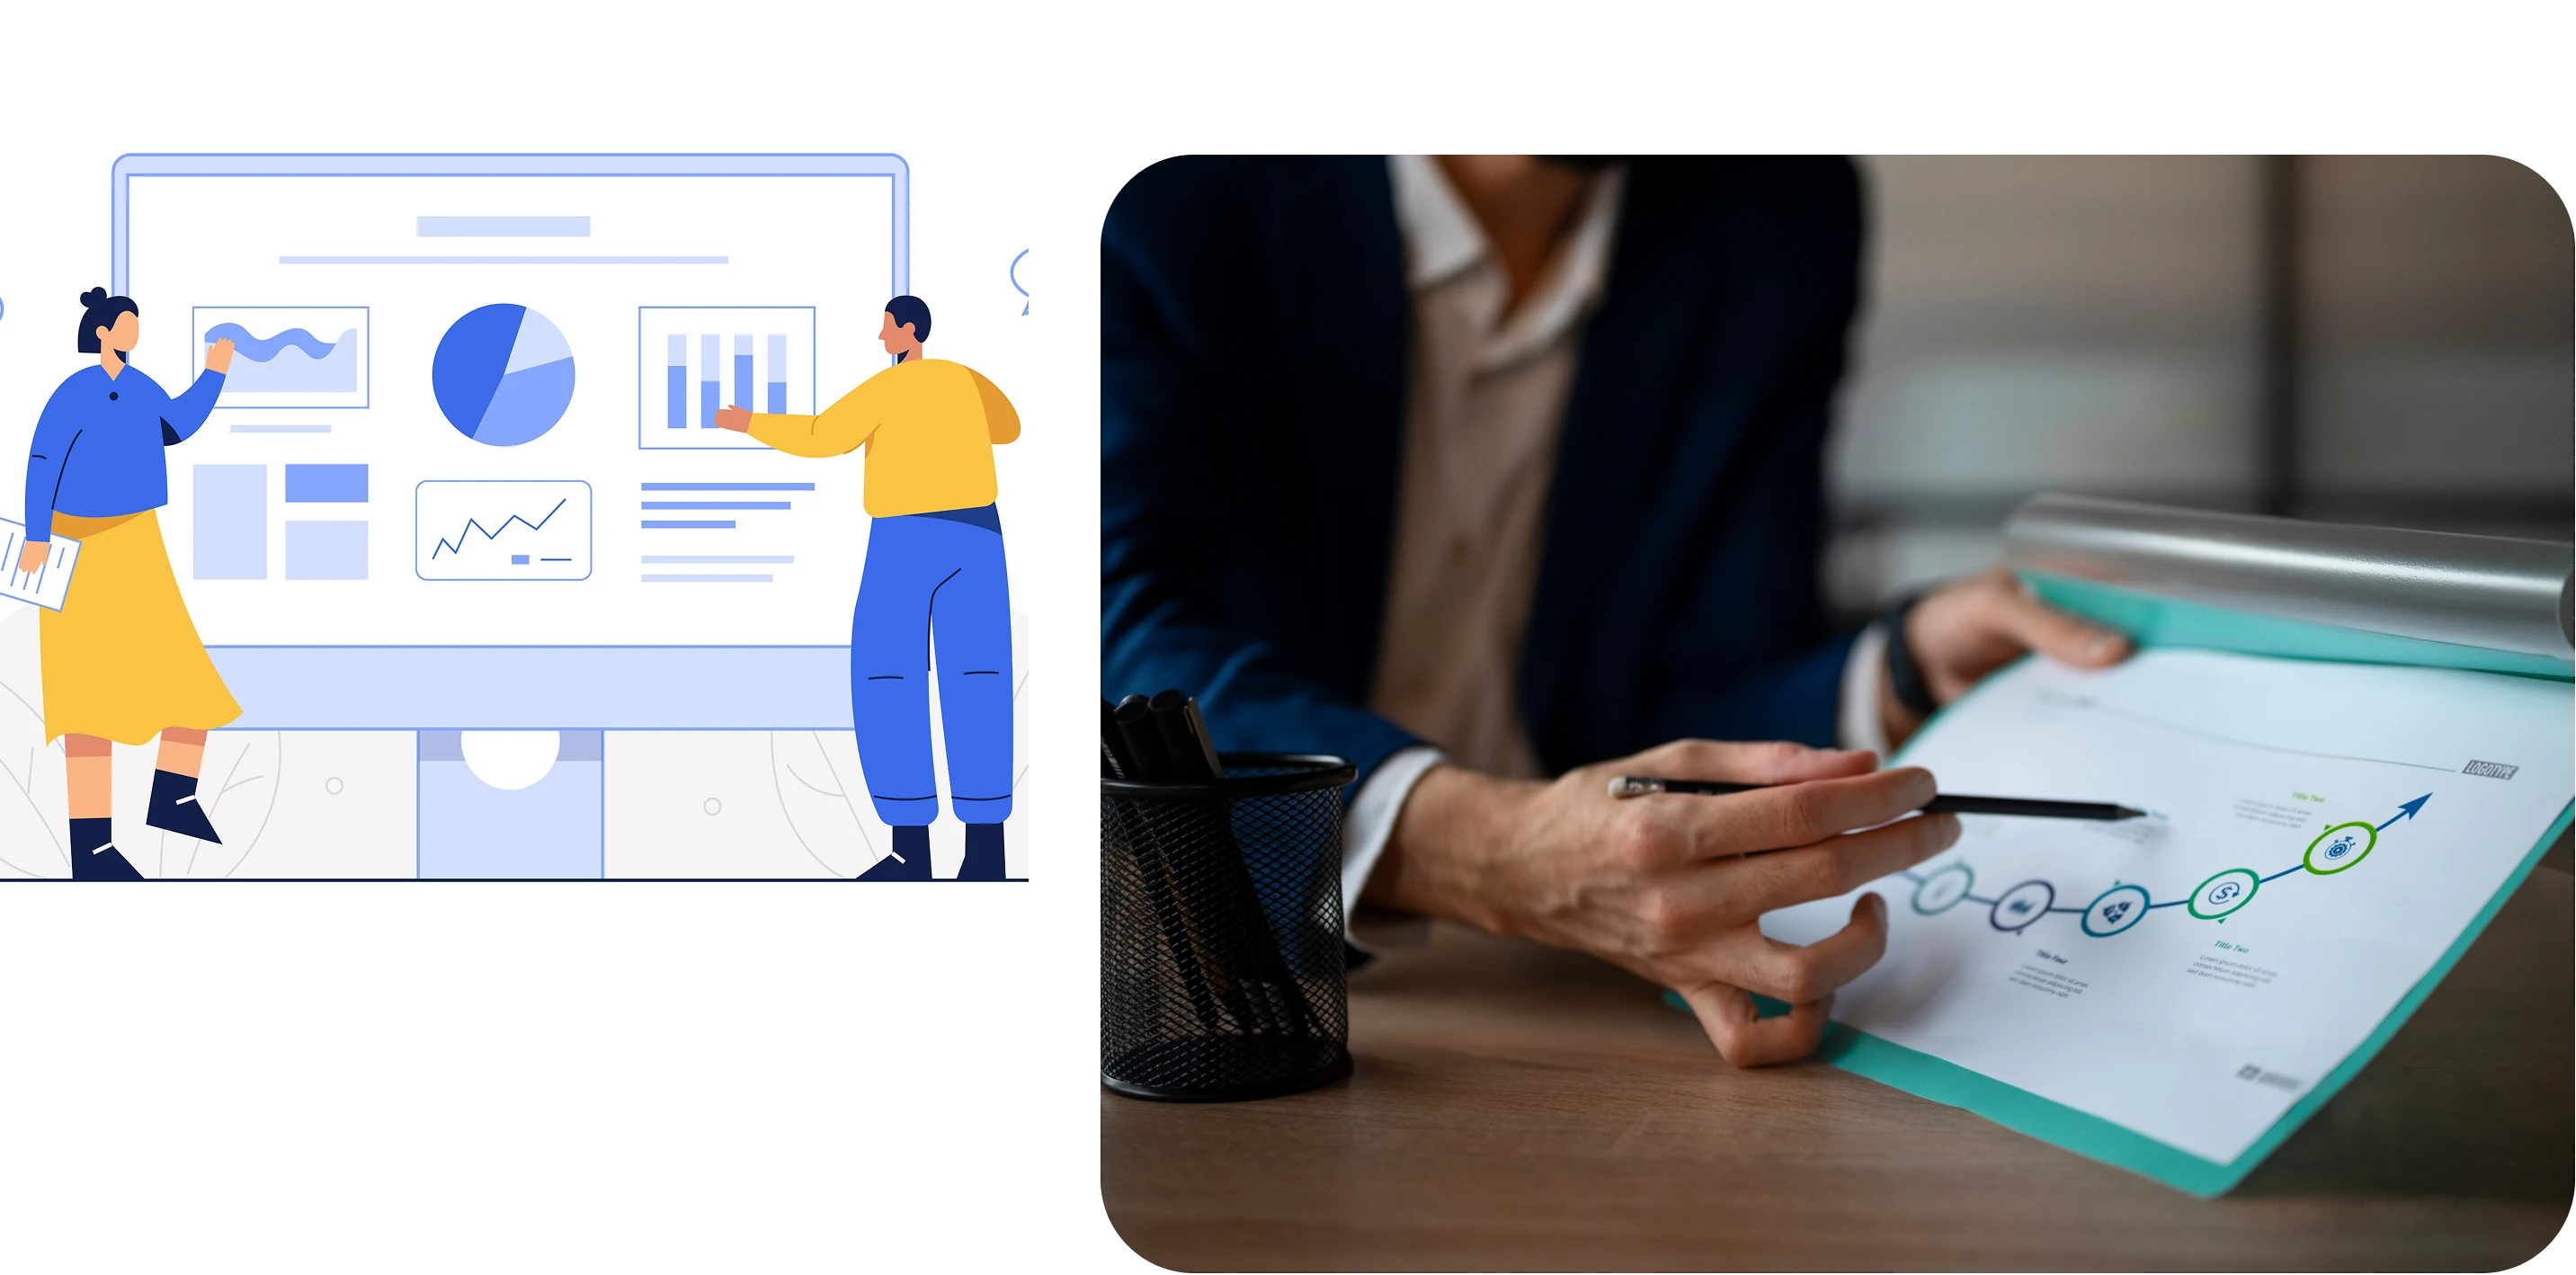
You can obtain actionable intelligence about your event’s performance with robust analytics tools. Track attendance numbers, engagement velocity, and user behavior to make data-driven decisions that elevate attendee satisfaction and sponsor value.
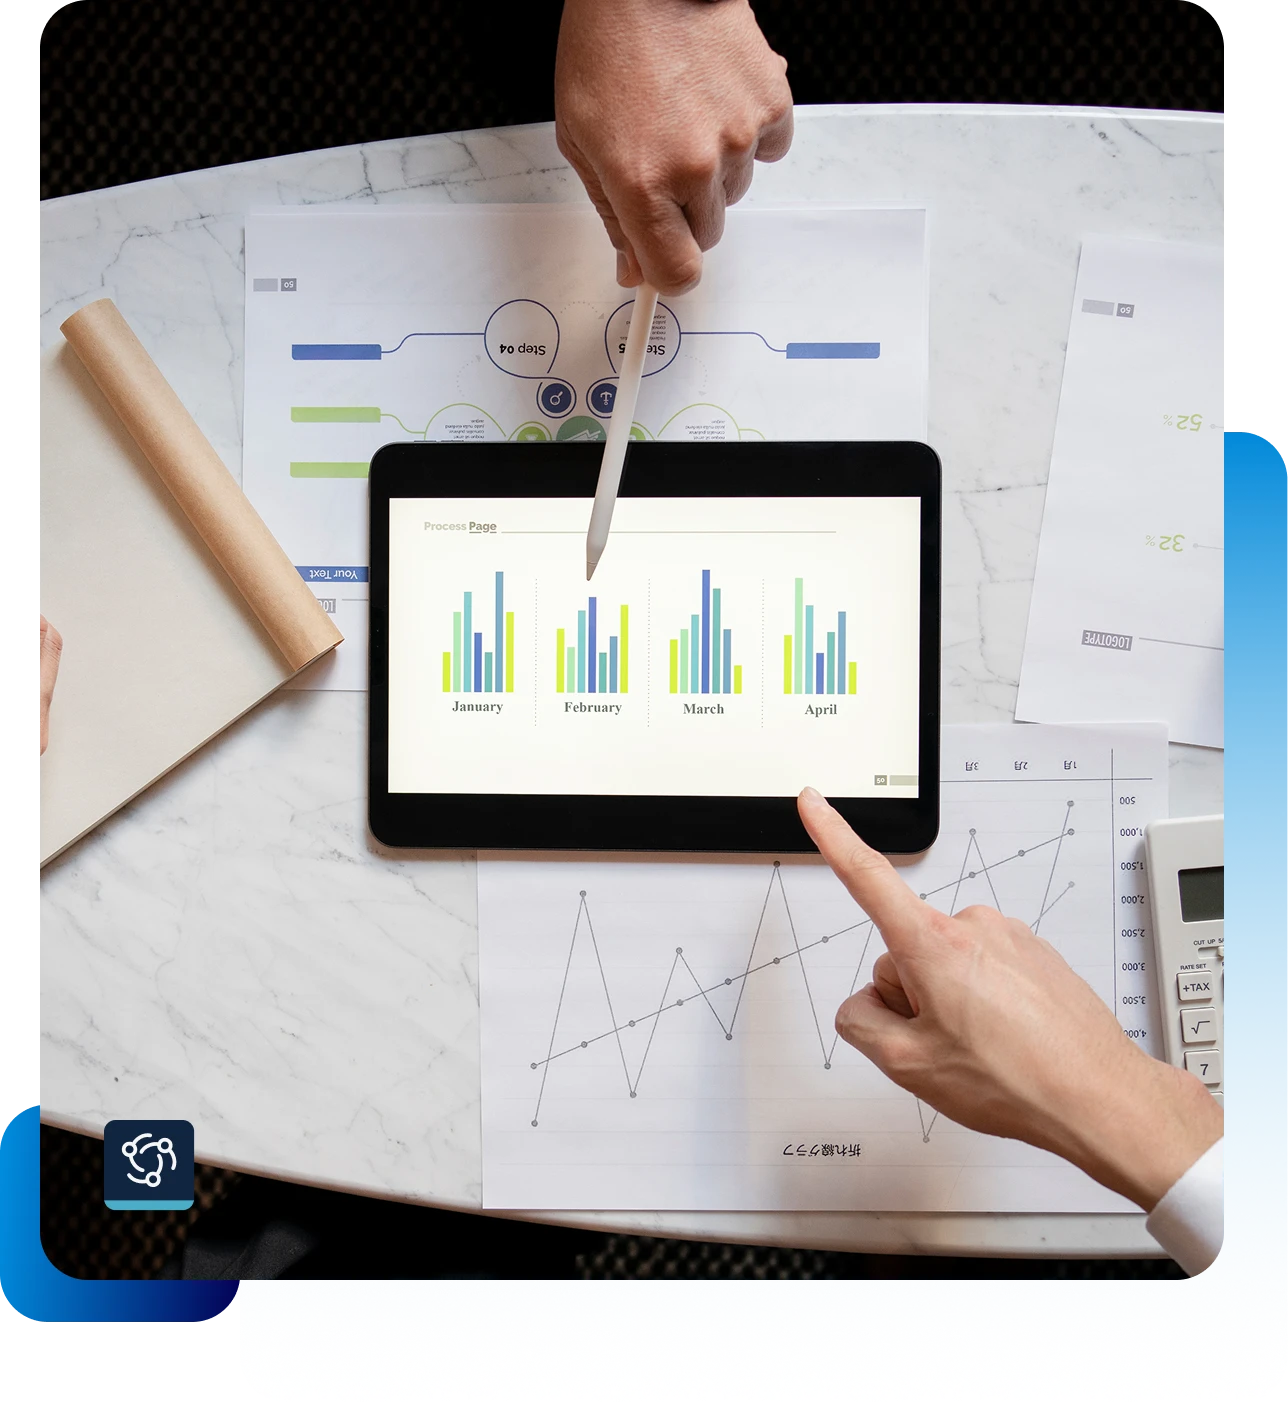
Dynamic event analytics provides real-time operational intelligence through interactive dashboards and live telemetry. Organizers can monitor hall check-in velocity, concurrent session popularity, app engagement levels, and participant flow as the event unfolds. This empowers on-site managers to dynamically adjust room capacities, redirect overflow traffic, and resolve bottlenecks before they impact attendee experience.
- Live attendance counters: Real-time room occupancy metrics synced across RFID and QR scanners.
- Engagement velocity tracking: Live monitoring of app session questions, poll submissions, and document downloads.
- Instant operational alerts: Automated threshold notifications when session rooms approach fire-safety capacity limits.
Live caption and multilingual speech analytics

Events.studio features proprietary live caption and transcription analytics integrated directly into our event operations console. Event owners can evaluate multilingual adoption, speech recognition accuracy, audience sentiment reactions, and bookmark trends during presentations in real time.
- Language distribution analysis: Track exact breakdown percentages of delegate preferred translation languages (e.g., Traditional Chinese, Japanese, Spanish, French).
- Speech recognition quality indicators: Monitor live transcription accuracy scores, rewrite rates, and average word revisions to guarantee pristine audio-visual standards.
- Audience caption reactions: Measure real-time attendee emotional reactions (claps, likes, insights) mapped second-by-second to specific presentation moments.
- Bookmarked moments telemetry: Identify the exact keynote quotes and presentation slides most frequently bookmarked by delegates for post-event review.
Personalized attendee recommendations and AI matchmaking

Recommendation engines analyze attendee session history, stated research interests, and exhibitor profile visits to curate individualized session itineraries and peer matchmaking suggestions. Powered by our conference mobile application, this smart curation boosts engagement and maximizes networking ROI.
- AI-powered session suggestions: Recommend relevant keynote topics and breakout discussions tailored to each attendee’s industry specialty.
- Exhibitor matchmaking: Connect buyers with matching booth sponsors based on demographic tags and product interest selections.
- 1-on-1 meeting intelligence: Suggest high-compatibility networking connections to facilitate productive commercial exchanges.
Performance benchmarking and post-event reporting
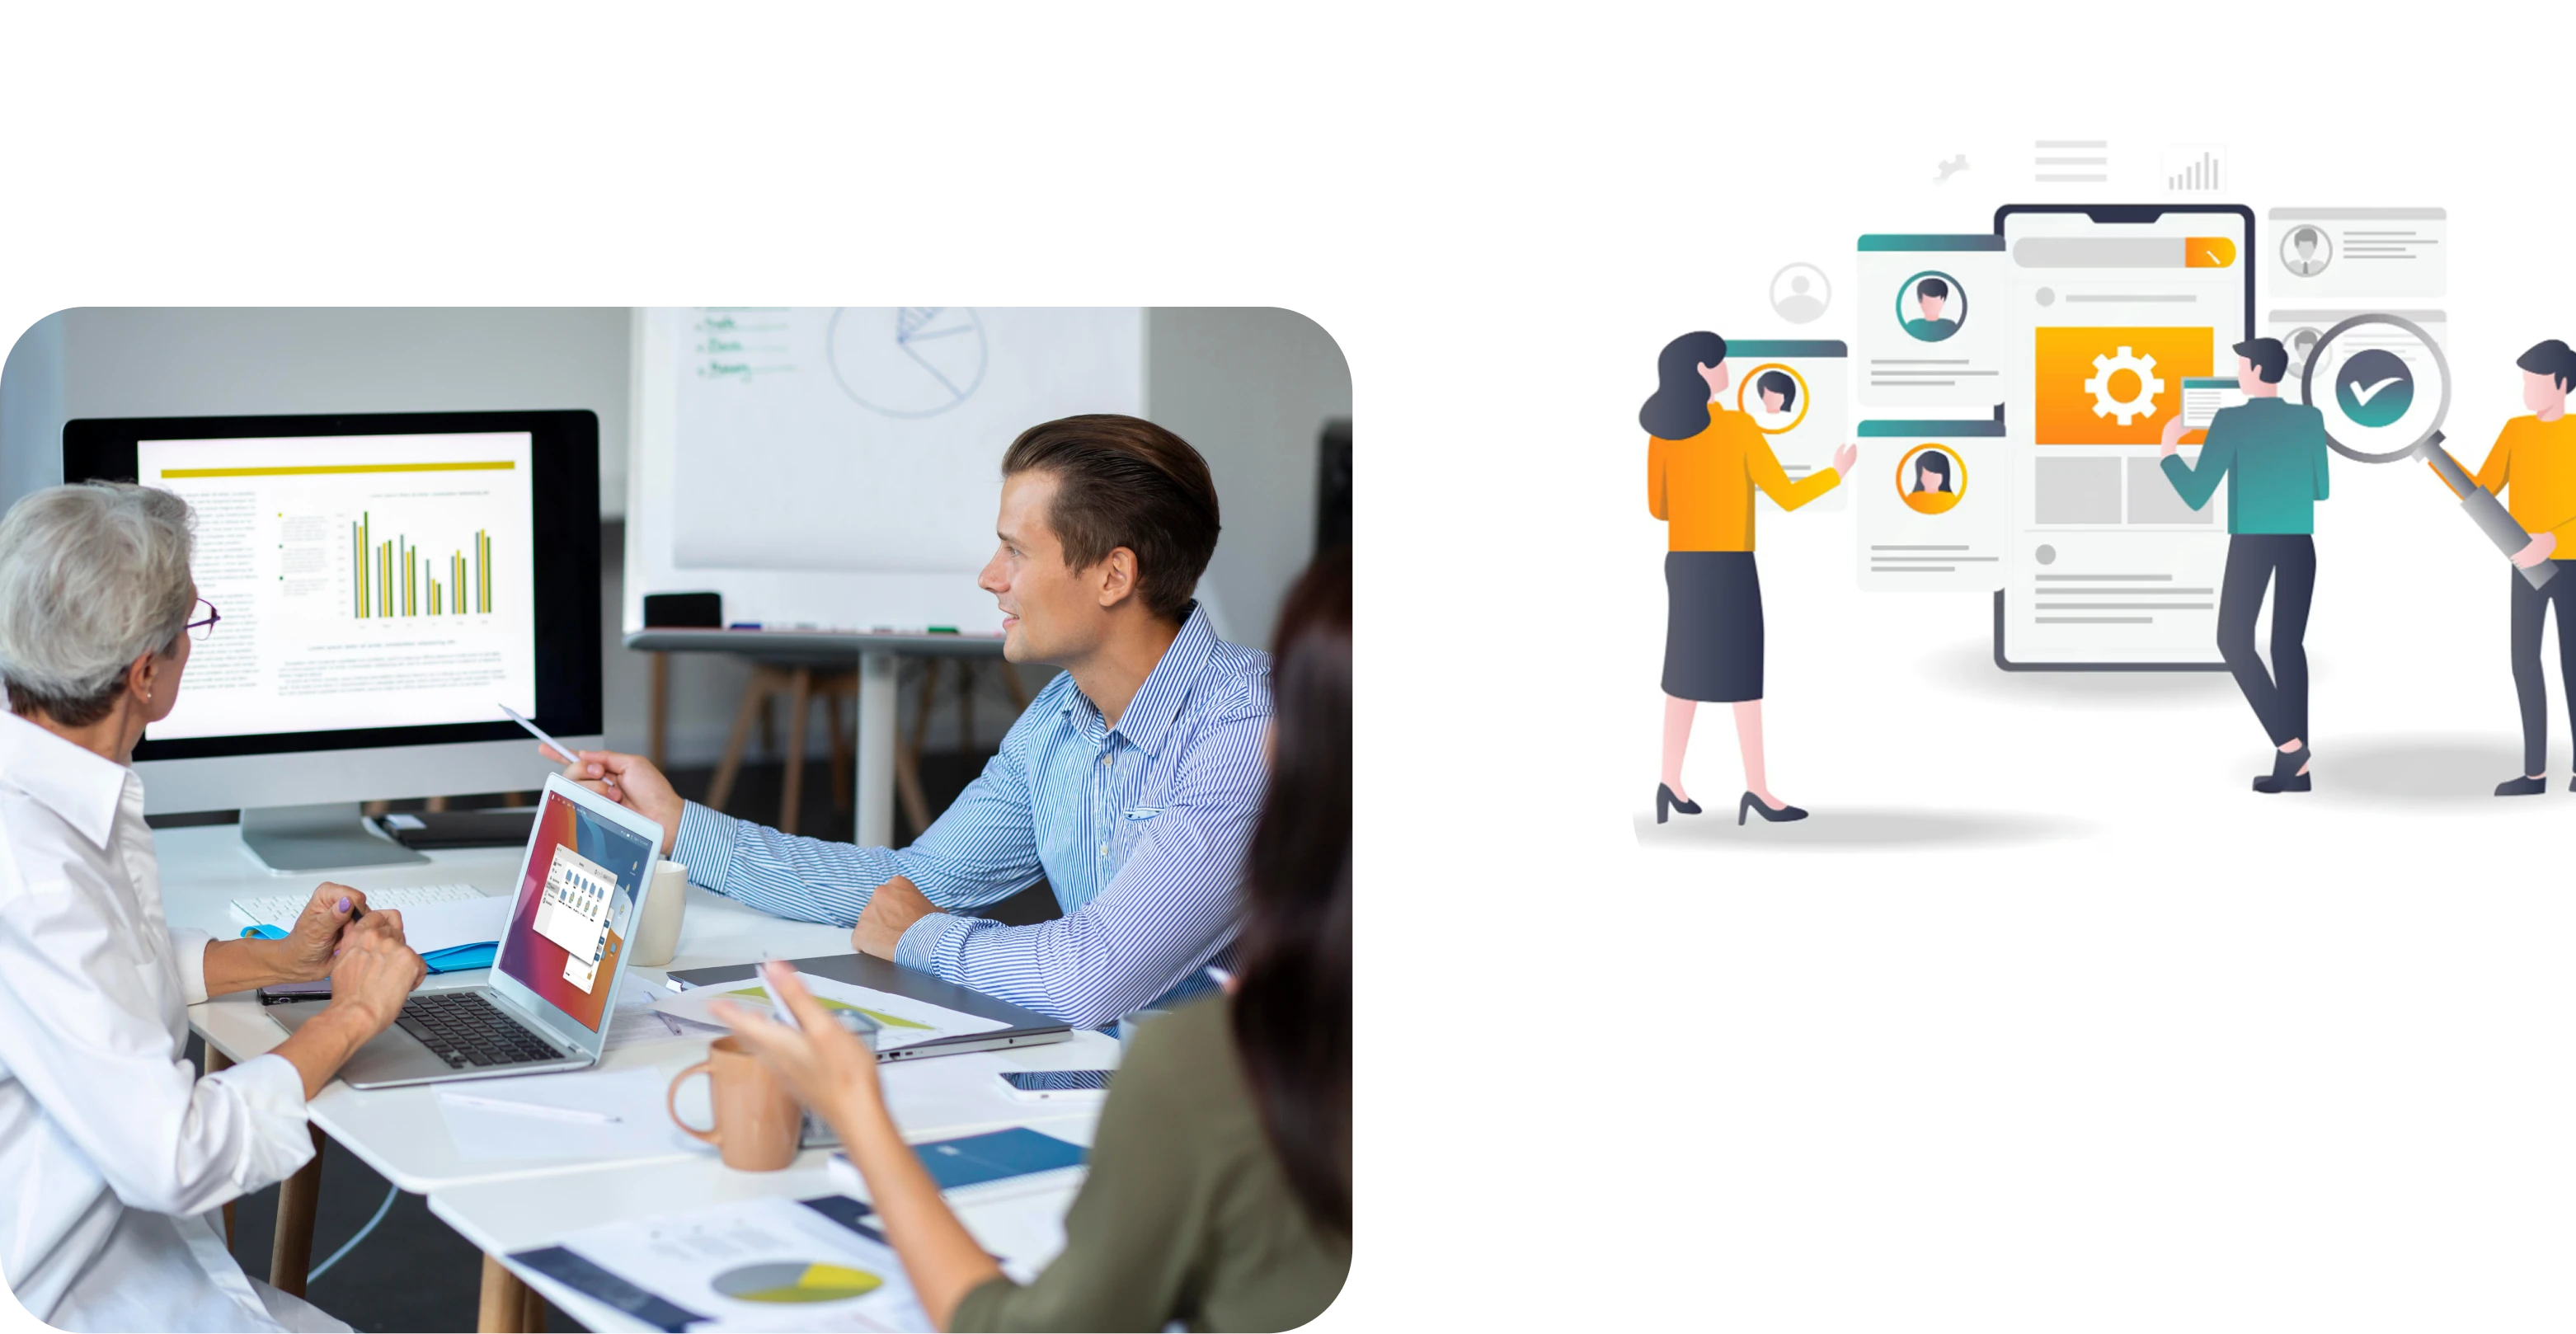
Our event analytics tool delivers automated benchmarking against industry standards and historical event editions. By comparing registration conversion rates, session completion averages, and sponsor dwell metrics, organizers gain quantitative evidence to demonstrate event value to corporate sponsors and board members.
- Year-over-year comparison: Measure growth in delegate retention, international attendance, and ticket revenue.
- Sponsor ROI validation: Provide exhibitors with verified lead engagement logs, booth foot-traffic metrics, and dwell time reports.
- Post-event synthesis: Export comprehensive, executive-ready PDF analytics reports within minutes of event conclusion.
NFC, RFID, and on-site attendee location tracking

Contactless NFC and RFID technologies embedded into delegate badges enable privacy-safe movement tracking across exhibition floors and conference halls. Without cumbersome manual sign-in sheets, organizers discover true traffic flow patterns, peak visiting hours, and zone popularity to optimize venue floor plans for future conferences.
- Contactless session scanning: Tap-to-enter authentication taking under 2 seconds per delegate.
- Venue heatmapping: Visualize density clusters to prevent congestion at catering and registration zones.
- CME accreditation tracking: Automatically log verified minutes spent inside scientific lecture halls to issue accredited certificates.

Event analytics platform comparison
How Events.studio compares to generic event software and post-event survey tools:
| Feature | Events.studio Analytics Engine | Standard event apps | Survey-only tools |
|---|---|---|---|
| Real-time attendance & room capacity alerts | Yes (sub-second streaming) | Delayed / batch sync | No |
| Live caption usage & language distribution analytics | Yes (built-in telemetry) | No | No |
| NFC / RFID dwell time tracking per session & booth | Yes (accurate down to the minute) | Basic QR scan only | No |
| Audience reaction & sentiment timeline mapping | Yes (live emotional heatmap) | Basic star rating only | Post-event only |
| Automated CME credit verification & certification | Yes (instant calculation) | Manual export required | No |
| Direct sync with registration and badge printing | Yes (native integration) | Third-party webhook setup | No |
| Executive PDF report builder with benchmarking | Yes (one-click generation) | Raw CSV export only | Basic charts |
Key benefits of leveraging event analytics
- Empirical ROI demonstration: Prove concrete attendee engagement and sponsor exposure with auditable data rather than guesswork.
- Data-driven program design: Understand which topics, formats, and keynote speakers generate maximum audience retention.
- Proactive crowd control: Anticipate traffic bottlenecks and reallocate staff to high-demand registration and dining areas in real time.
- Enhanced sponsor monetization: Provide exhibitors with quantifiable dwell times and qualified lead logs to justify premium sponsorship pricing.
- Privacy-compliant intelligence: Collect vital behavioral data while adhering strictly to global GDPR and ISO 27001 data protection protocols.
How event analytics works (step-by-step framework)
- Data collection setup: Configure tracking points across online registration via our conference registration system, NFC badge check-in kiosks, mobile app interactions, and live caption streams.
- Live event monitoring: Operations teams monitor real-time dashboards for hall capacities, caption accuracy, network throughput, and attendee engagement.
- Immediate on-site optimization: Make agile adjustments to room schedules, send targeted push notifications, and balance crowd flows dynamically.
- Post-event synthesis & reporting: Generate executive summaries, deliver sponsor lead metrics, calculate CME credits, and benchmark results against historical milestones.
Videos on event analytics and event technology
Academic references on event analytics and attendee behavior
- Getz, D., & Page, S. J. (2016). Progress and prospects for event tourism research. Tourism Management, 52, 593–631.
- Buhalis, D., & Foerste, M. (2015). SoCoMo marketing for travel and tourism: Empowering co-creation of value. Journal of Destination Marketing & Management, 4(3), 151–161.
- Kim, D., & Fesenmaier, D. R. (2015). Measuring the impact of mobile event apps on attendee satisfaction. Journal of Convention & Event Tourism, 16(3), 205–224.
- Bowdin, G., Allen, J., O’Toole, W., Harris, R., & McDonnell, I. (2011). Events management (3rd ed.). Elsevier Butterworth-Heinemann.
Looking to unlock actionable analytics for your next event?
Whether you need live attendance heatmaps for a 20,000-delegate convention or deep multilingual caption analytics for a global hybrid congress, our event technology team can configure a tailored analytics stack for your organization. Connect with our specialists for a personalized walkthrough.

Rick Lee
Project Manager – Event Technology
Email: rick.lee@globibo.com
Portfolio: Event Technology Events Studio
With over 10 years of experience in event technology, Rick is an expert in integrating cutting-edge tech solutions for seamless event execution. His expertise includes event analytics dashboards, NFC attendee tracking systems, simultaneous interpretation setups, and interactive audience response solutions. Rick has managed technology deployments for major corporate symposiums and government conferences across Asia-Pacific.
Frequently asked questions on event analytics
1. What is event analytics?
Event analytics is the systematic collection, measurement, and analysis of behavioral and operational data generated throughout an event lifecycle. It tracks registration conversions, session attendance, attendee dwell time, digital engagement via mobile apps, live polling, and speech captioning to deliver empirical insights on event ROI and audience satisfaction (Kim & Fesenmaier, 2015).
2. How does real-time attendee tracking work at in-person events?
Real-time attendee tracking utilizes contactless NFC or RFID chips embedded in printed badges, as well as high-speed QR code scanners at room entrances. When delegates enter a hall or exhibitor booth, the system logs their timestamped arrival and exit, calculating precise dwell times and current room occupancy without creating check-in queues.
3. What are live caption and transcription analytics?
Caption analytics tracks how delegates consume live audio transcriptions and multilingual subtitles. Events.studio provides real-time reporting on language breakdown percentages, transcription accuracy rates, audience emotional reactions mapped to speech moments, and the specific keynote segments delegates bookmark most frequently for post-event study.
4. How does event analytics help prove sponsor and exhibitor ROI?
Rather than relying solely on estimated badge scan counts, our analytics platform provides exhibitors with auditable foot-traffic data, average visitor dwell times, and categorized lead qualification scores. Sponsors receive comprehensive post-event reports demonstrating exact impressions and delegate interactions.
5. Is attendee location tracking compliant with privacy regulations like GDPR?
Yes. Events.studio is built with strict privacy-by-design principles compliant with GDPR and ISO 27001 standards. Attendee location tracking is conducted via secure tokenized badge IDs, aggregated for crowd heatmaps, and individual attendee profiles are only shared with exhibitors when explicit consent is granted during digital badge scanning.
6. Can the analytics platform automatically calculate Continuing Medical Education (CME) credits?
Yes. By cross-referencing delegate NFC tap timestamps with the accredited session schedule, the platform calculates the exact duration each attendee attended eligible lectures and automatically generates personalized CME certificates ready for download in the conference mobile application.
7. How does event analytics integrate with our registration system?
Our analytics engine connects natively with our conference registration system. Demographic data, ticket categories (e.g., VIP, speaker, regular attendee), and pre-selected interests are automatically synchronized with on-site tracking to deliver segmented behavioral reporting by ticket tier.
8. What format are post-event analytics reports delivered in?
Post-event reports can be exported immediately into polished executive PDF presentations, interactive web dashboards, or raw data spreadsheets (CSV and XLSX) for integration with enterprise CRMs such as Salesforce, HubSpot, and association management systems.
Contacts
Certification

Testimonials




Event Technology